|
You may work in a group of 2 or by yourself on this webquest.
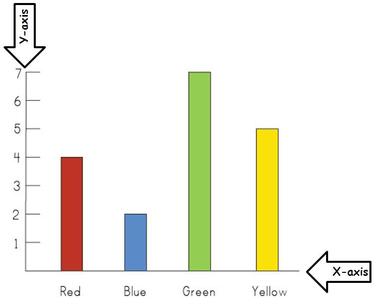
TASK #1 Take a piece of paper home and record the following data: A. Write down how many shoes are in your house. (1 pair of shoes should be recorded as 2 shoes). B. Write down how many belts are in your house. C. Write down how many pants are in your house. D. Write down how many hats are in your house. E. Bring your data paper back to school and record your data under "TASK #1" in your notebook. TASK #2 In your notebook you are going to make a bar graph. You will need to write the labels "shoes", "belts", "pants", and "hats" along the x-axis of your graph (along the bottom). You will need to write the numbers along the y-axis of your graph (along the left side). Use the graph to the right as an example. The graph on the right goes to the number 7. Your highest number will be the greatest number recorded in your data in TASK #1. Draw your bars according to your data. Make sure your bars are on top of the correct label. TASK #3 WRITE 3 questions about your graph. You need to also WRITE THE ANSWERS to your questions: Question #1: Which piece of clothing are there the most of? Question #2: Which pieces of clothing are almost the same amount? Question #3: (you write a "how-many-more" question using two of your bars) DON'T FORGET TO WRITE YOUR ANSWERS!!!!!!!! I wrote example questions on the right. But they are only examples. Your questions need to be about YOUR data :) |
|


